Data Plane
3 minute read
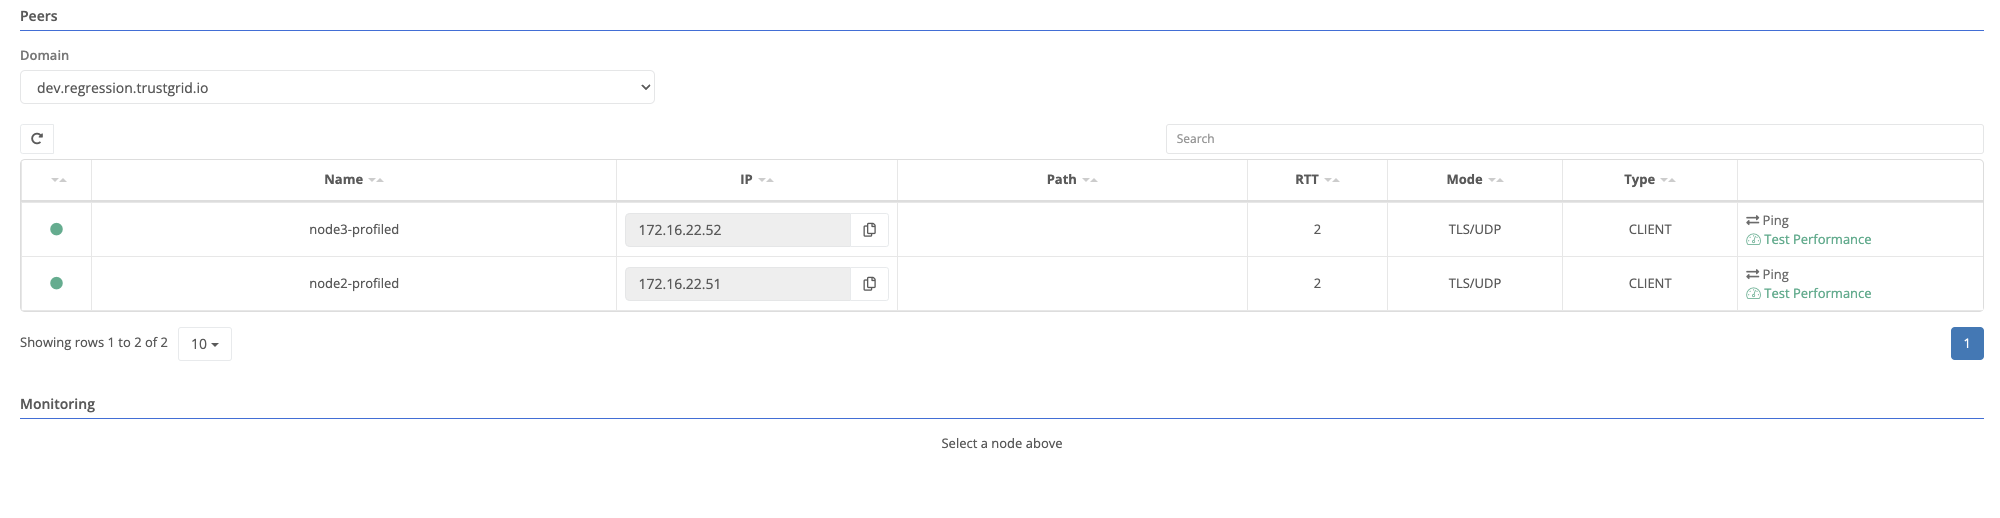
The Data Plane panel shows a list of all statistics known peers, their connection status, provides tools for testing connectivity and can display statistics for the connection between the node and the peer.
Export List of Peers
You can export a CSV formatted list of all peers by clicking Actions -> Export

The CSV file will include columns for:
- Connection status (true/false)
- Peer name
- Peer IP
- Path (if applicable)
- RTT - Return Trip Time or latency observed when the panel was opened or refreshed
- Mode - TLS or TLS/UDP
- Type - The role of the node to peer. SERVER = gateway, CLIENT = edge device
- Ports - The ports used to establish the connection
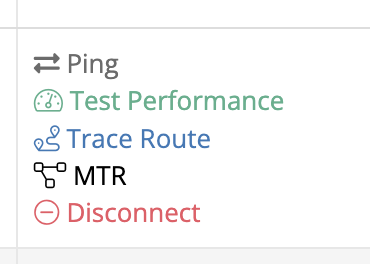
Tools
The far right column as links to launch the tools listed below:
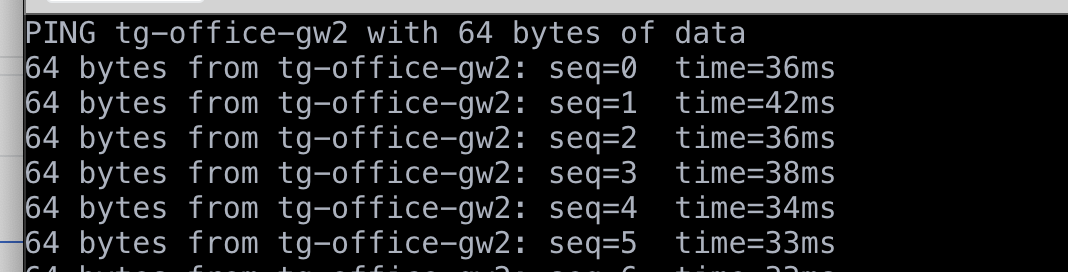
Data Plane Ping
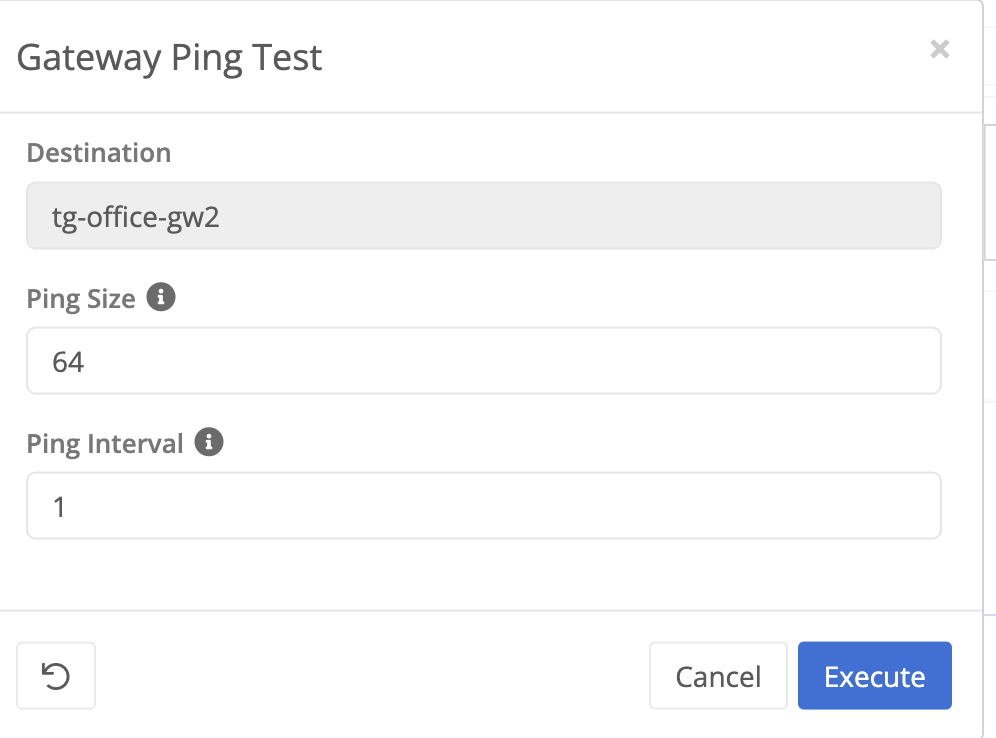
The gateway ping tool will launch a ping inside the data plane tunnel between the node and the gateway, similar to ICMP ping. This can provide a more realtime view of latency between node and gateway compared to the RTT column (only loaded on refresh) and the historical data which provides a minute by minute view.
Data Plane Performance Tool
The gateway performance tool attempts to estimate the available upload bandwidth between current node and the selected peer.

By default this tool will attempt to send 10MB of data to the destination device. This then used to calculate the available bandwidth. Sending more data provides a more accurate estimate but be aware that other devices using the same internet circuit may experience degraded performance while the test is running.
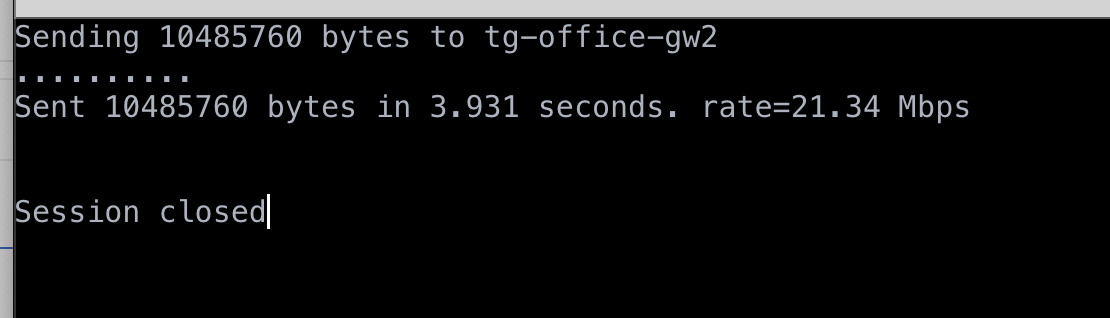
The periods are posted for about every 1MB of data sent. If you see exclamation marks this can indicate lost packets.
Trace Route and MTR
Both of the links here will populate the interface tool of the same name with the selected peer’s IP address and TCP port. This allows you to trace the route or run MTR diagnostics directly between the current node and the selected peer.
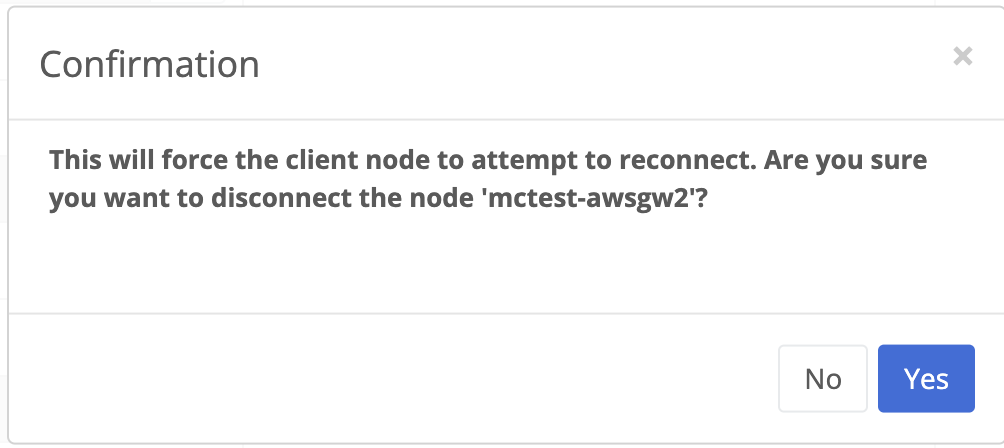
Peer Disconnect
The disconnect button will disconnect the node from the selected peer. The tunnel should be reestablished automatically but there will be a period of disruption.
After clicking the link, you will be prompted to confirm the action.
View Latency to Peers
To view latency data between two nodes, select either the edge or gateway node, and then from the peers table, select the node to view.
Once a peer is selected, the monitoring section will populate with relevant data.
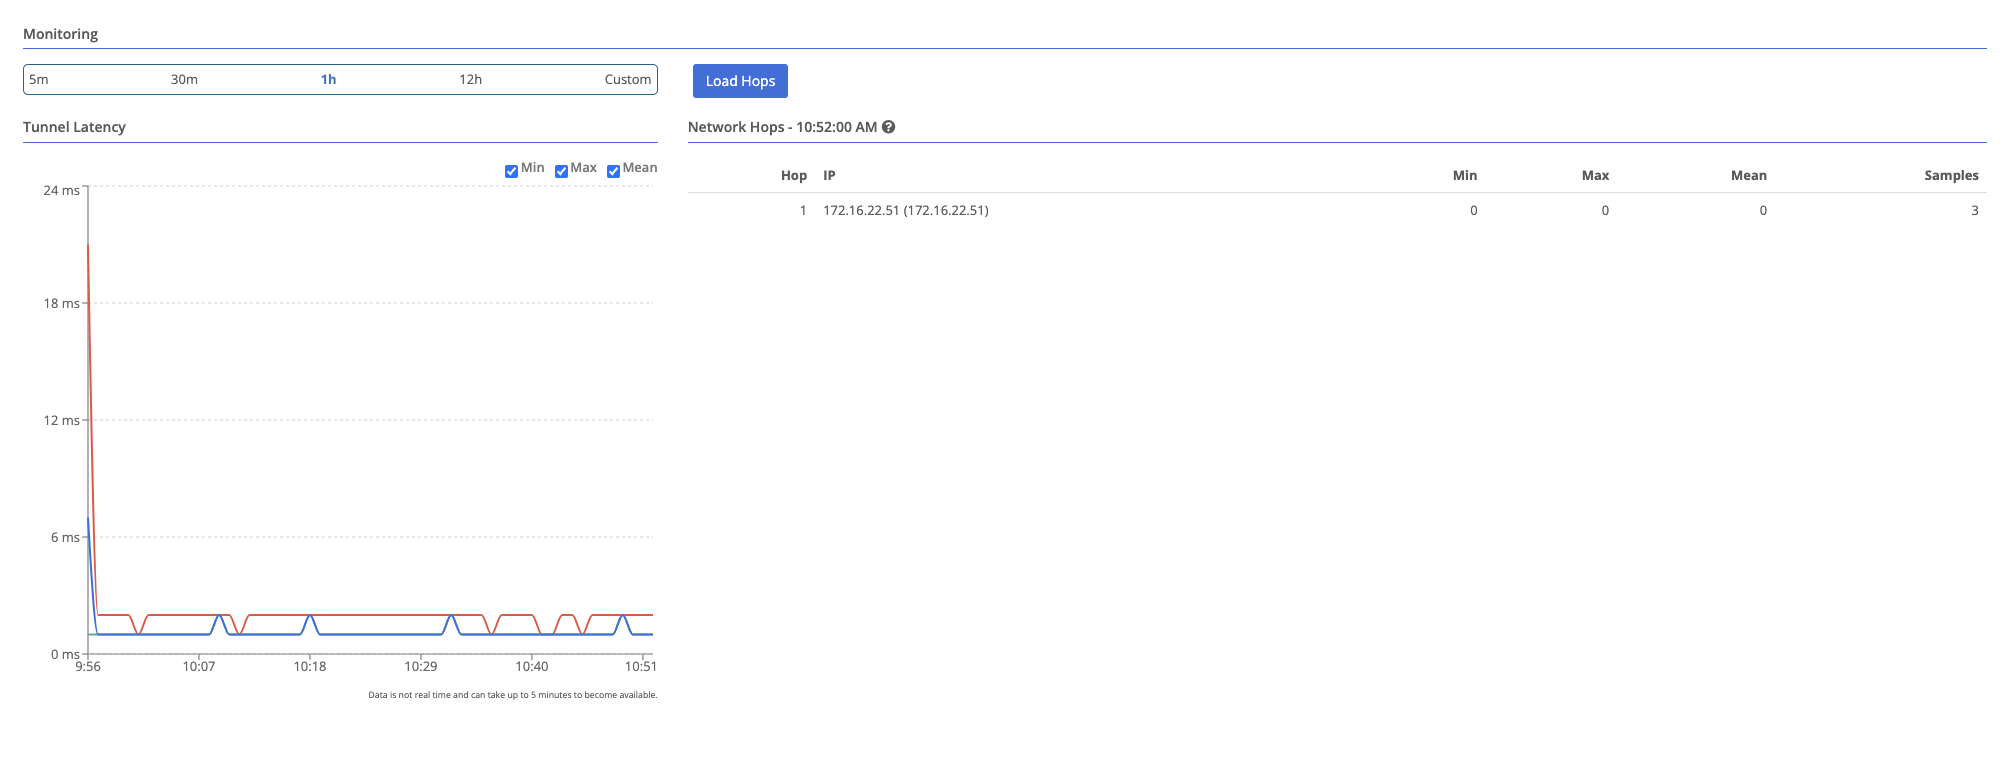
Hop data is only available for nodes that have hop monitoring enabled. See Monitoring Network Hops to Peers.
Feedback
Was this page helpful?
Glad to hear it! Please tell us how we can improve.
Sorry to hear that. Please tell us how we can improve.