Thresholds
Define threshold limits for node resource utilization and trigger events
3 minute read
Thresholds provide a way to trigger events when different measurements exceed a given value. Thresholds configured at the node level can override Domain Thresholds.

Node Level Threshold Status

| Field Name | Description |
|---|---|
| Status |
|
Configuring Node Level Thresholds
To view and configure thresholds, a user will need
nodes::configure::thresholds permissions.To configure thresholds at the node level:
- Navigate to the node in the portal.
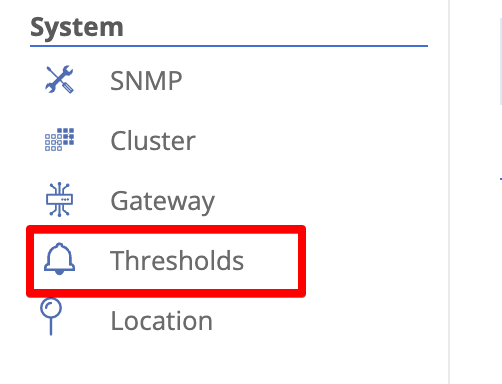
- In the left-side navigation bar find Thresholds in the System section and click it.
- Change the Status to “Enabled”.
- Click the + button on the far right to add either a Load or Network threshold.
- Provide the required fields.
- Optionally, repeat with any other thresholds you wish to set.
- Click save.
Load Thresholds
Load thresholds measure the health of the node itself.
Load Metrics
| Metric Type | Description | Default Value |
|---|---|---|
| CPU Usage | Monitors percent of CPU usage across all cores | 95% for 10 minutes |
| Memory Usage | Monitors percent of total memory (RAM) used | 90% for 30 minutes |
| Disk Usage | Monitors percent of total disk usage for the root partition | 80% for 1 minute |
| Embrionic Flows | Monitors the number of TCP flows (connections) that are in the embryonic state (waiting for ACK) | none |
| JVM Heap | Monitors the percent of allocated JVM memory used | none |
Load Fields
| Field Name | Description |
|---|---|
| Name | The name of the threshold. This will be available in generated events. |
| Telemetry | The metric to monitor. Options are CPU usage (%), memory usage (%), disk usage (%), and embryonic flows (absolute count). |
| Threshold | The value that must be exceeded for an event to be generated. |
| Duration | The time period to measure. If the threshold is exceeded for this duration, an event will be generated. |
Network Thresholds
Network thresholds measure the health of the network from the node’s perspective.
Network Metrics
| Metric Type | Description | |
|---|---|---|
| Latency (ms) | Monitors the round trip tunnel latency between this node and the target | |
| Bandwidth IN Usage (Mbps) | Monitor the amount of received bandwidth on the specified interface | |
| Bandwidth Out Usage (Mbps) | Monitors the amount of sent bandwidth on the specified interfaces |
Network Fields
| Field Name | Description |
|---|---|
| Name | The name of the threshold. This will be available in generated events. |
| Telemetry | The metric to monitor. Currently only latency (measured in milliseconds) is available. |
| Threshold | The value that must be exceeded for an event to be generated. |
| Duration | The time period to measure. If the threshold is exceeded for this duration, an event will be generated. |
| Target |
|
Feedback
Was this page helpful?
Glad to hear it! Please tell us how we can improve.
Sorry to hear that. Please tell us how we can improve.